
目次
ジュリア集合とは?
ジュリア集合は、複素平面上の特定の点の集合であり、フラクタルの一種です。フラクタルとは、どんなに拡大しても同じようなパターンが現れる図形のことです。
ジュリア集合の生成
ジュリア集合は、特定の複素数 cを用いて次の反復操作を行うことによって生成されます。
- 初期値として複素数z0を選びます。
- 次の式を反復的に適用する。この漸化式はマンデルブロ集合と同じです。
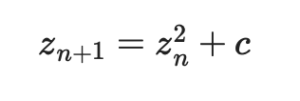
- 反復操作を無限に続けたときに、znが発散(無限大に近づく)かどうかを調べます。発散するならその点はジュリア集合に含まれません。発散しないなら、その点はジュリア集合に含まれます。
- この反復操作をすべての初期値z0に対して行い、結果として得られる集合がジュリア集合となります。(マンデルブロ集合は、初期値をz0=0と固定し、複素数cを変動させますが、ジュリア集合はその逆で、複素数cを固定し、初期値z0を動かします。そのため、ジュリア集合はcによって形が変わるという点が魅力的です。)
ジュリア集合の特徴
- 複雑な形状:ジュリア集合は非常に複雑な形状を持ちます。拡大しても同じようなパターンが現れる自己相似性が特徴的。
- パラメータ c:複素数 cの値によってジュリア集合の形状は大きく変わります。特定の cの値では、ジュリア集合が連結な形状を持つ場合もあれば、離散的な形状になる場合もあります。
ジュリア集合の例
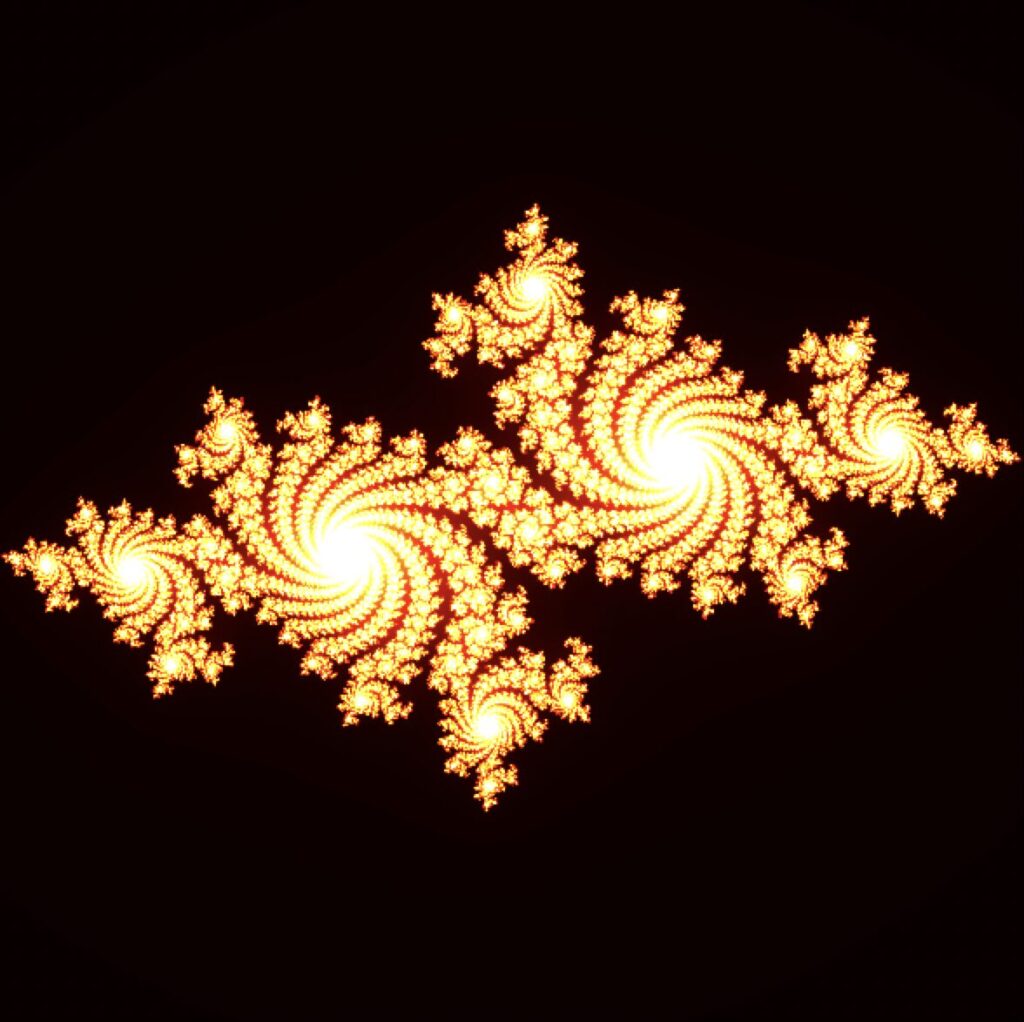
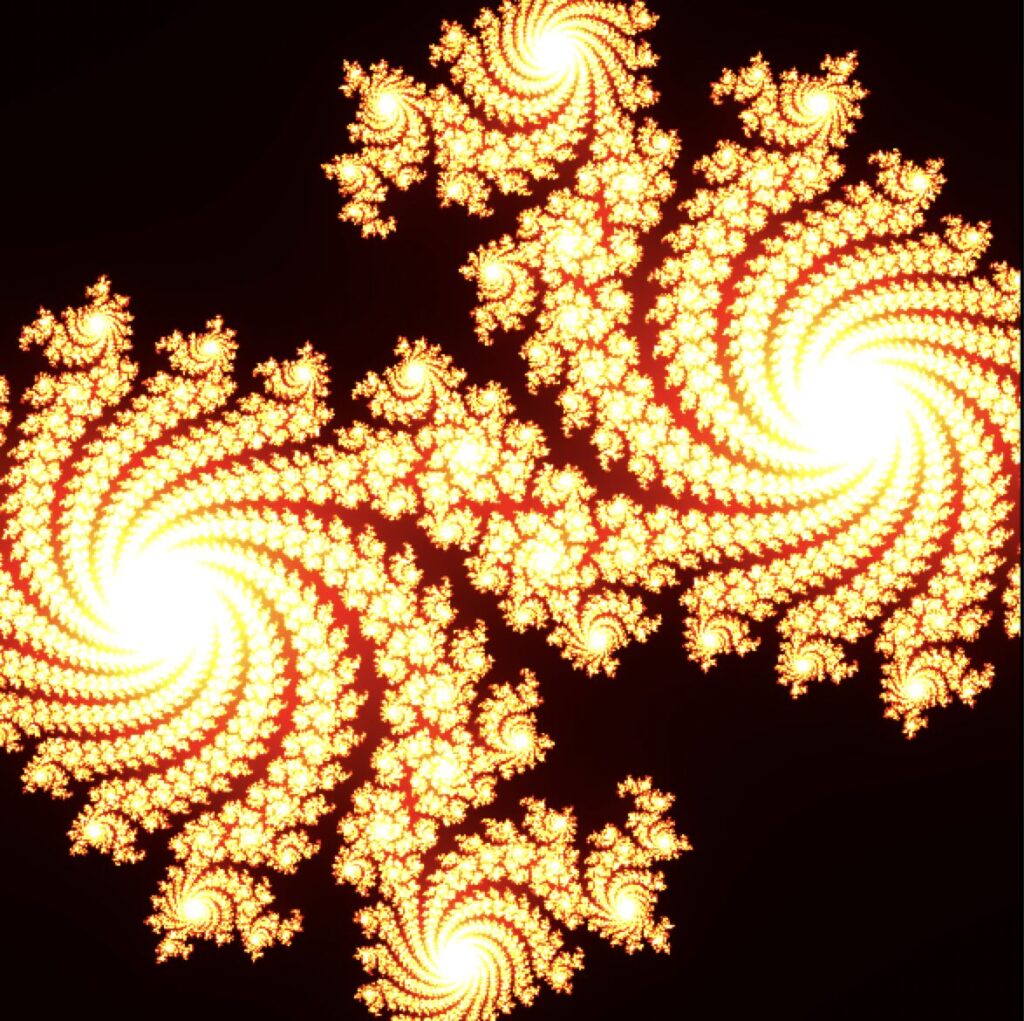
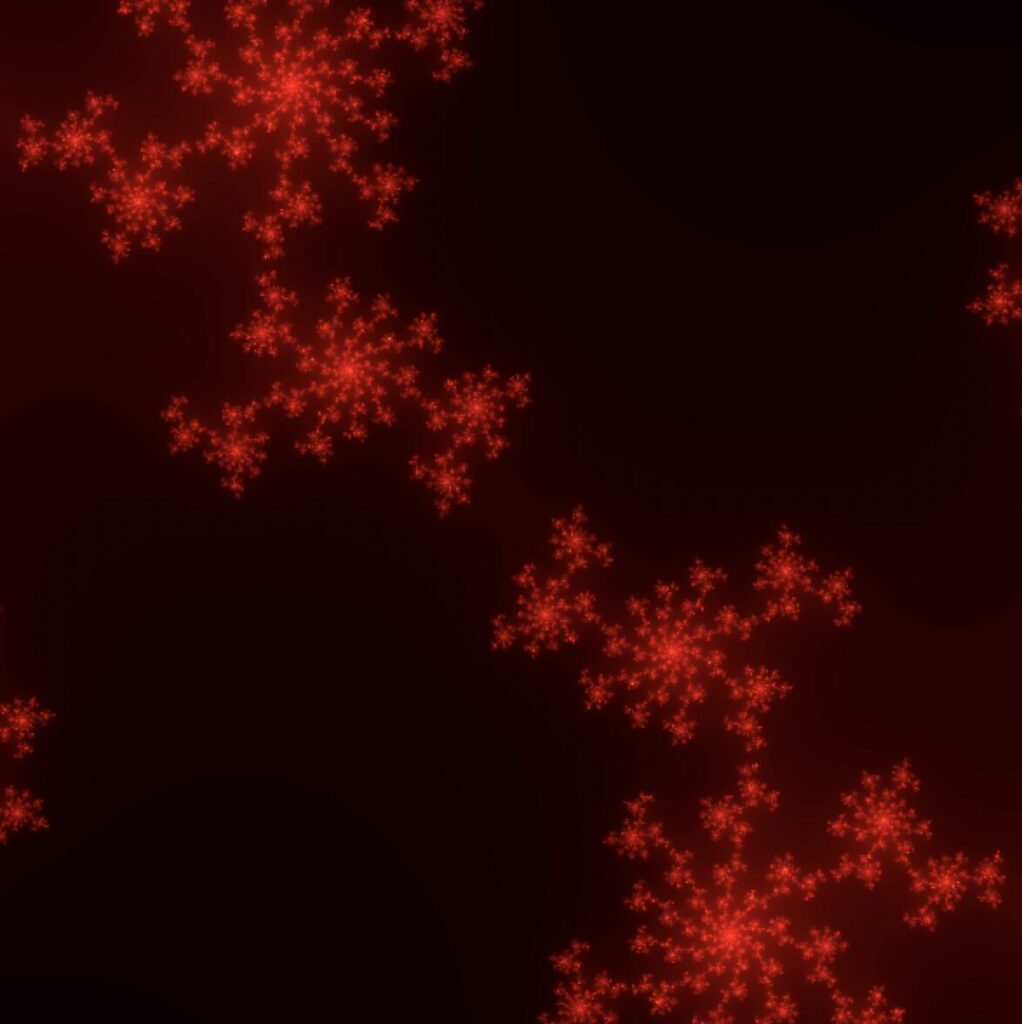
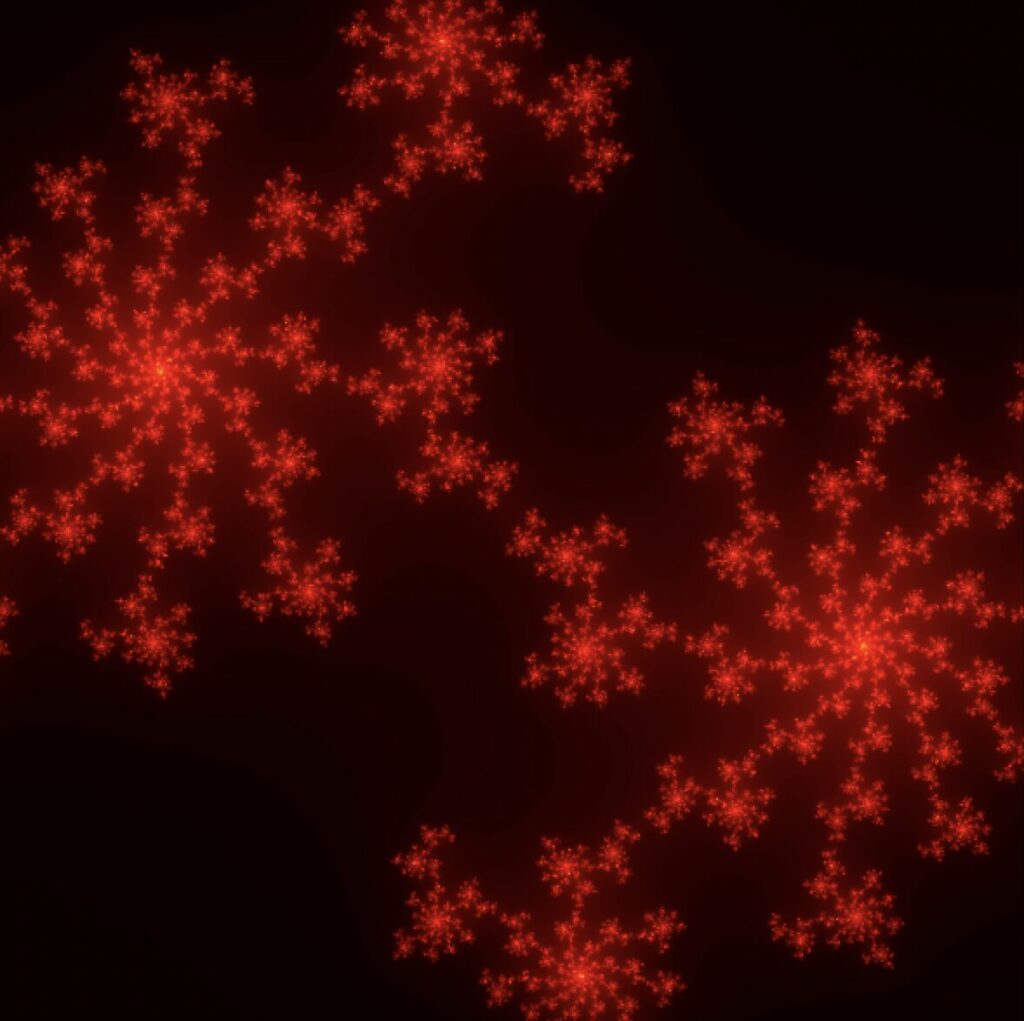
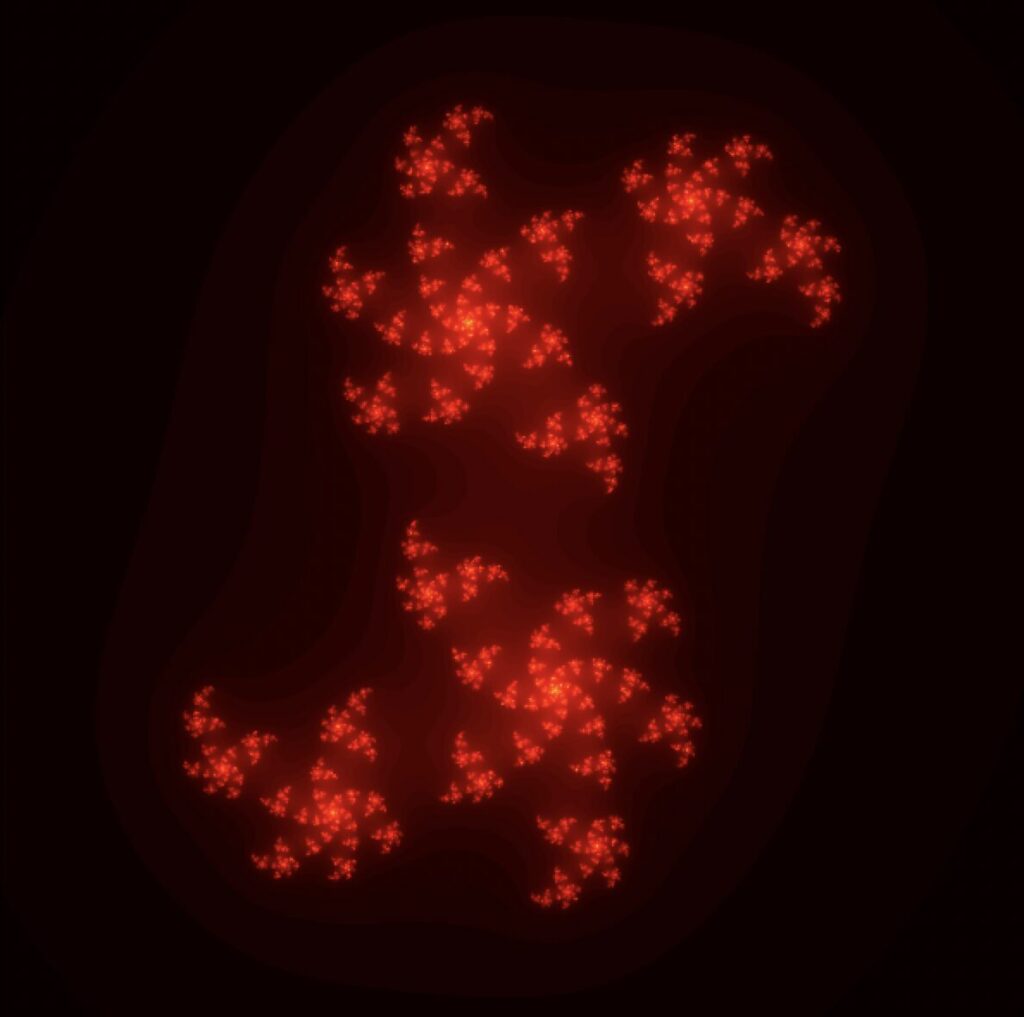
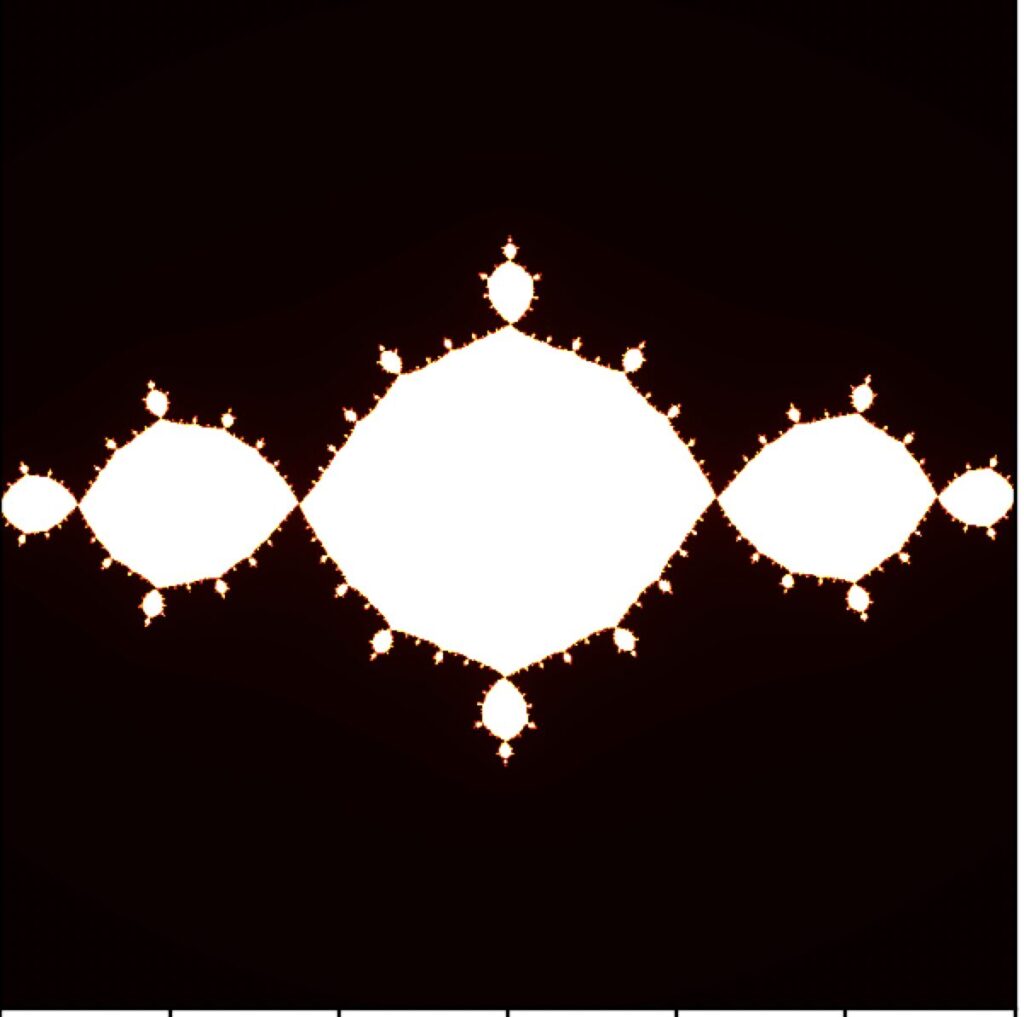
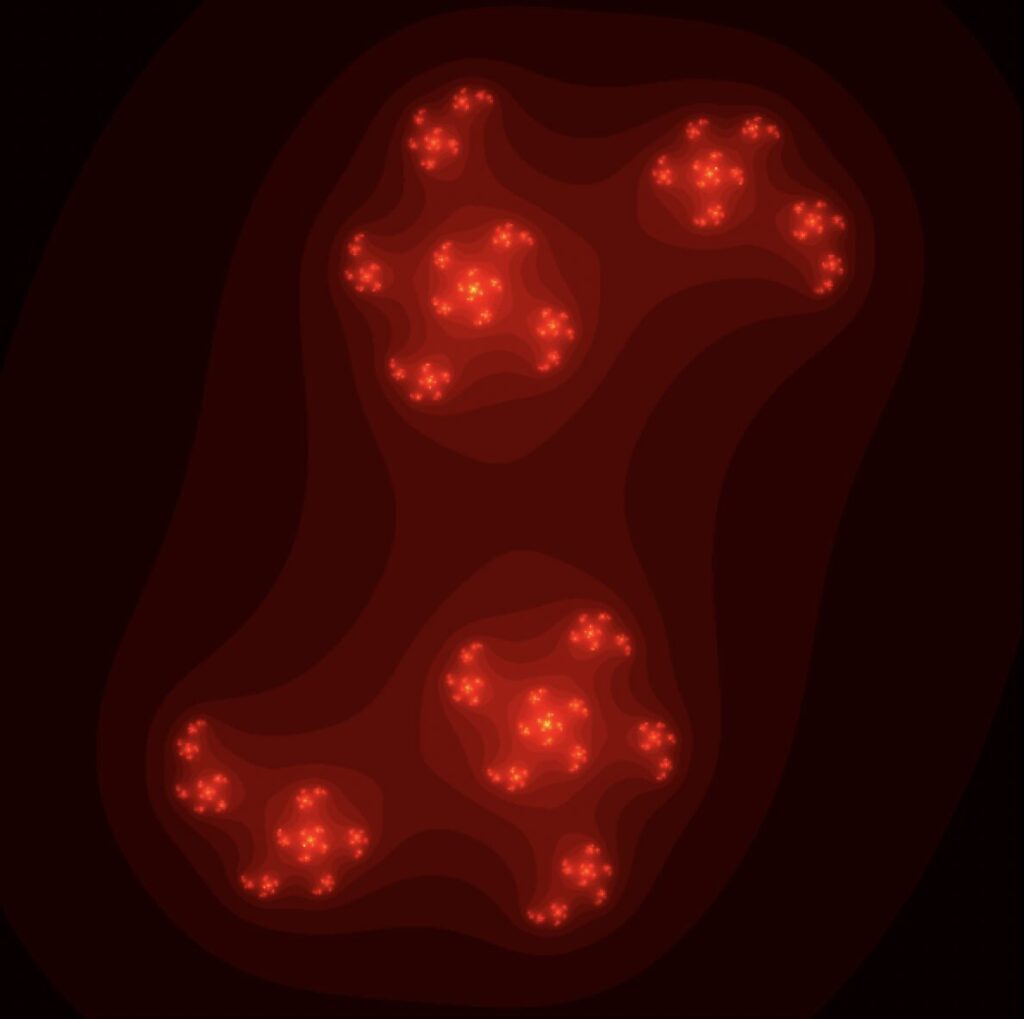
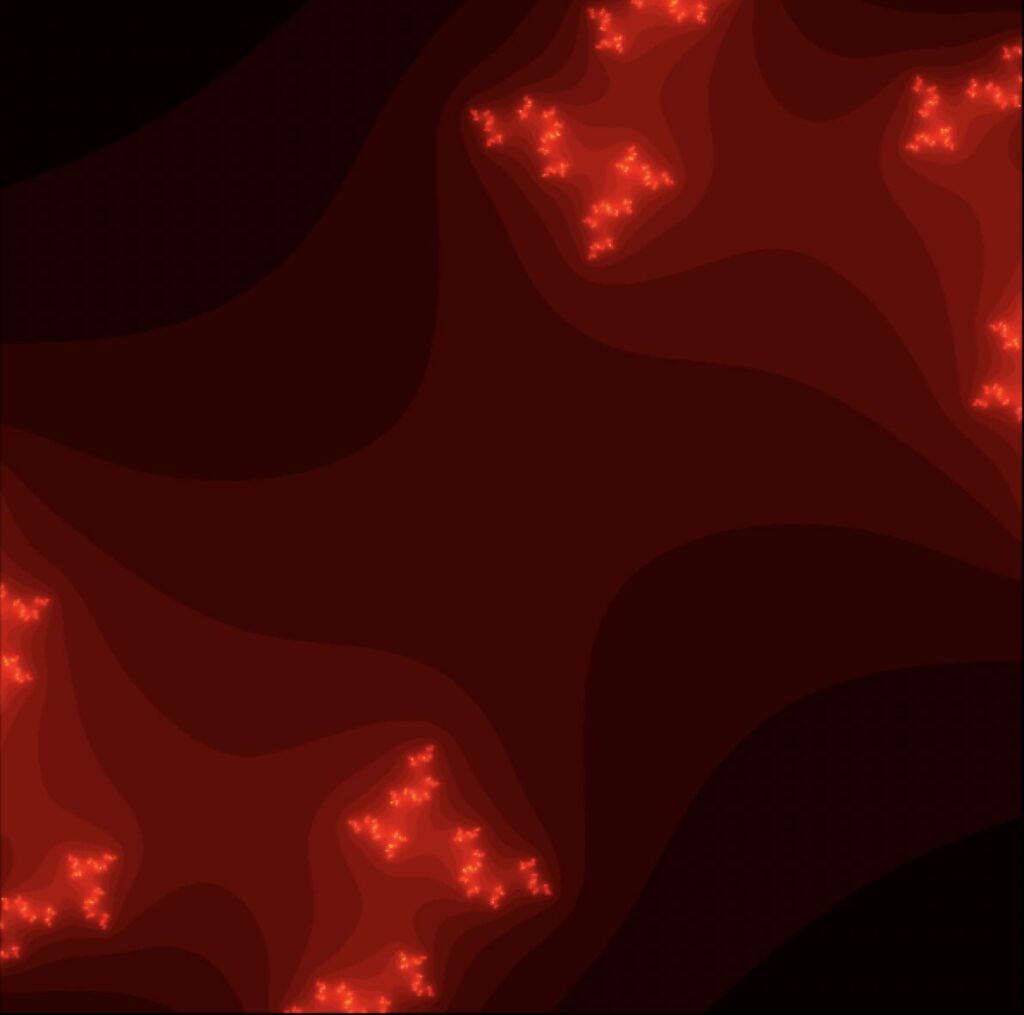
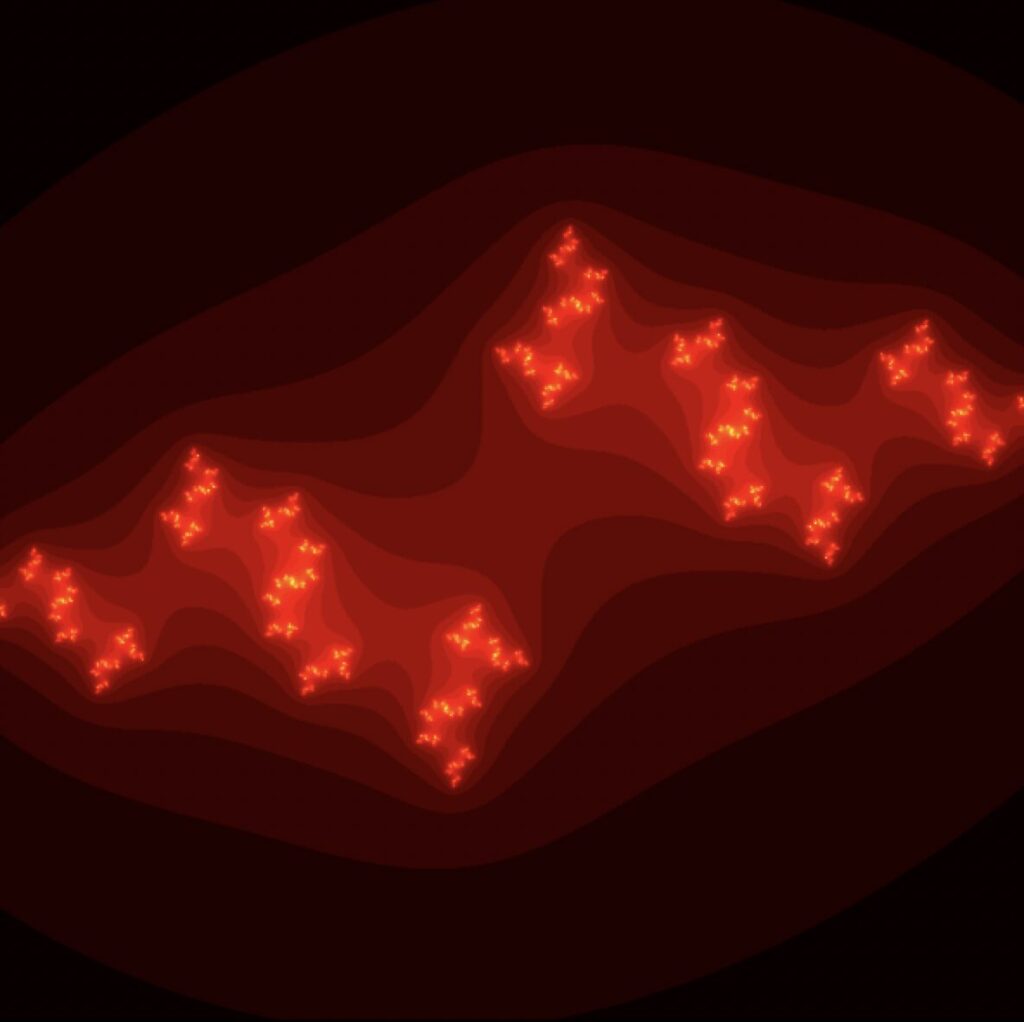
このように、ジュリア集合は非常に美しいパターンを持つため、芸術作品としても楽しまれています。
参考コード(Python)
import numpy as np
import matplotlib.pyplot as plt

def julia_set(c, width, height, x_min, x_max, y_min, y_max, max_iter):
    x = np.linspace(x_min, x_max, width)
    y = np.linspace(y_min, y_max, height)
    X, Y = np.meshgrid(x, y)
    Z = X + 1j * Y

    iterations = np.zeros(Z.shape, dtype=int)

    for i in range(max_iter):
        mask = np.abs(Z) < 2
        iterations[mask] = i
        Z[mask] = Z[mask] ** 2 + c

    return iterations

def plot_julia_set(julia, x_min, x_max, y_min, y_max):
    plt.imshow(julia, extent=(x_min, x_max, y_min, y_max), cmap='hot')
    plt.colorbar()
    plt.title('Julia Set')
    plt.xlabel('Re')
    plt.ylabel('Im')
    plt.show()

if __name__ == "__main__":
    c = complex(0.4, 0.4)  # The complex parameter for the Julia set
    width, height = 800, 800  # Resolution of the image
    x_min, x_max = -1.5, 1.5  # x-axis range
    y_min, y_max = -1.5, 1.5  # y-axis range
    max_iter = 300  # Maximum number of iterations

    julia = julia_set(c, width, height, x_min, x_max, y_min, y_max, max_iter)
    plot_julia_set(julia, x_min, x_max, y_min, y_max)
複素数cのパラメータを入れ替えると、図形が変化します。